


Your design might be improving the experience. But can you prove what it’s worth to the business?
Imagine spending three weeks researching a checkout problem. You interview customers, identify where they’re struggling, redesign the experience, and present your findings to stakeholders.
The feedback is positive. Everyone agrees the new design looks better and feels easier to use.
Then someone from leadership asks, “What will this actually do for the business?”
And suddenly, the conversation becomes difficult.
You can explain the usability problems, the research findings, and the design decisions. But connecting those improvements to revenue, retention, or cost savings is another conversation entirely.
This is a challenge UX professionals need to get better at addressing.
In a July 2026 article, Nielsen Norman Group argued that UX teams need to report business outcomes rather than simply reporting activities and UX metrics. The distinction matters because executives make investment decisions based on the outcomes those activities are expected to produce.
Source: Nielsen Norman Group, Stop Reporting UX Activity and Report Business Outcomes
So this week, we’re doing something practical.
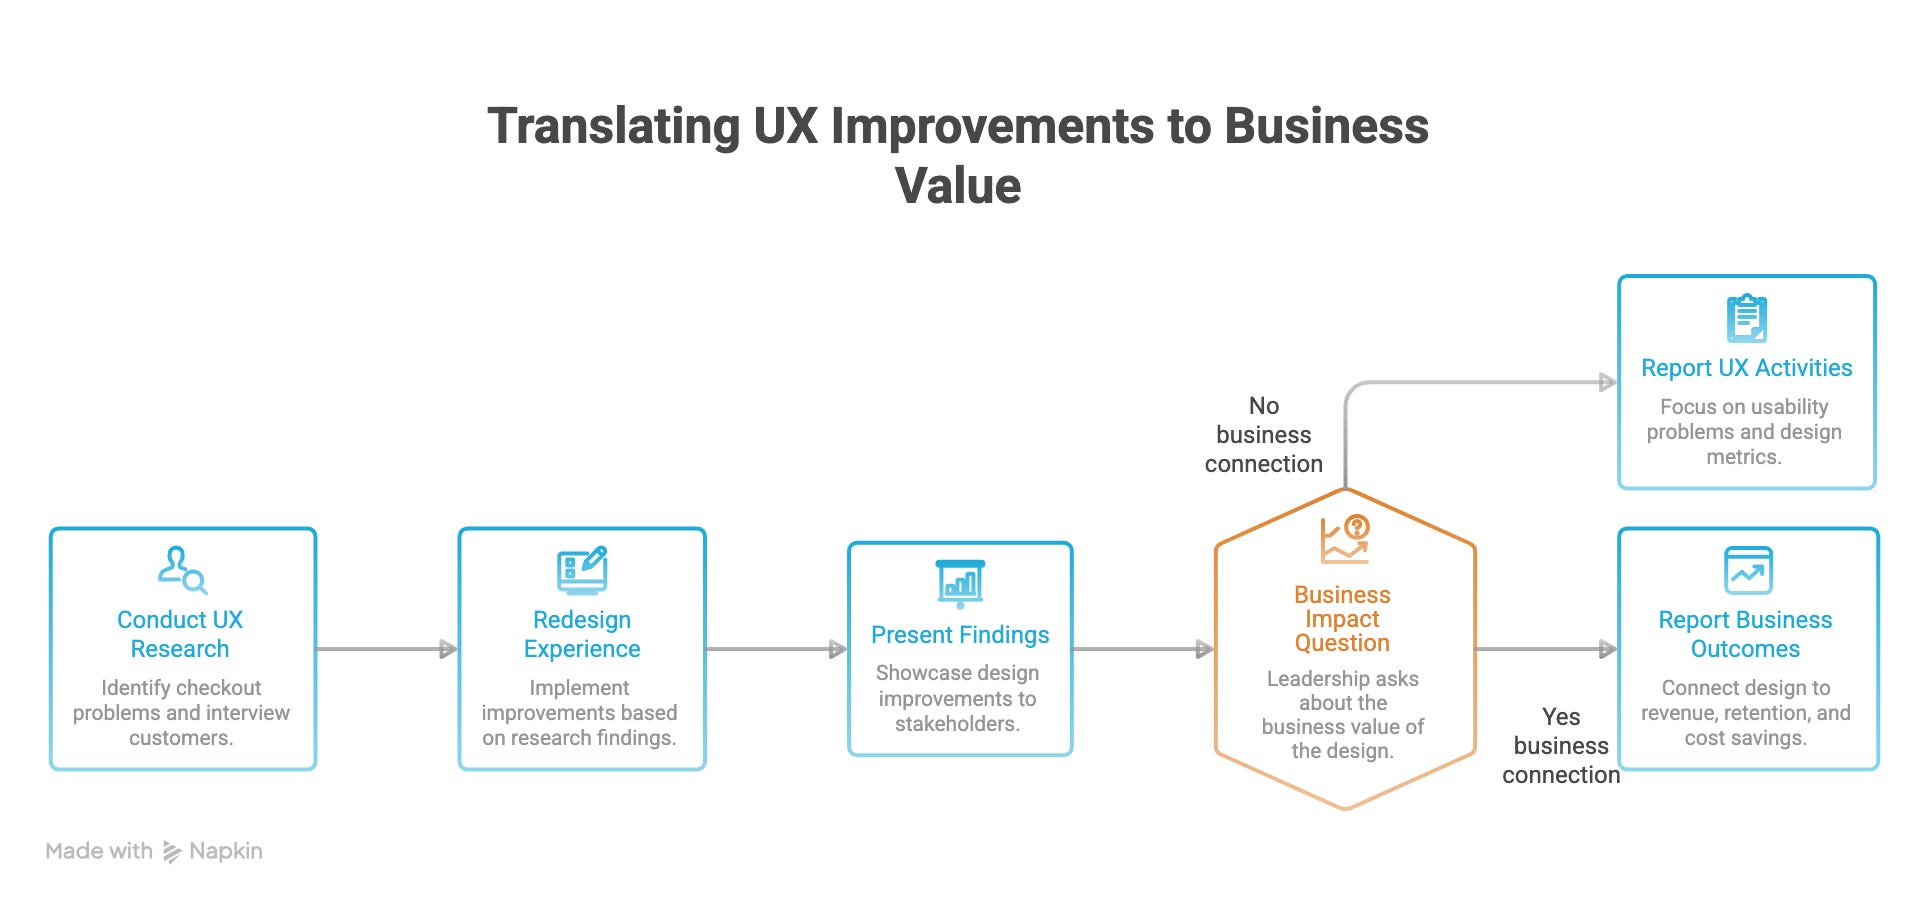
We’re breaking down how to translate UX improvements into business value, calculate potential financial impact, and build a stronger case for your design recommendations.
In this issue
The difference between UX metrics and business metrics
Four business metrics every designer should understand
How to calculate the potential revenue impact of a UX improvement
A five-step framework for building a UX business case
How to present your findings to stakeholders
A reusable worksheet for your next project
1. Why good design work doesn’t always get funded
Here’s something worth understanding: a company can agree that a design problem exists and still decide not to fix it.
Why?
Because every project competes for limited resources. Engineering time, research budgets, development costs, and competing business priorities all influence what gets approved.
Imagine your team discovers that customers find the checkout process confusing. Research participants struggle to understand the shipping options, and several abandon the process during testing.
From a UX perspective, the recommendation is straightforward: simplify checkout.
But leadership may be evaluating that recommendation against improving payment reliability, launching a new product feature, or reducing customer support costs.
Your job is to explain why solving the checkout problem deserves attention.
This is where business metrics become useful.
According to Baymard Institute’s 2026 checkout research, 17% of surveyed US online shoppers reported abandoning a purchase in the previous three months because the checkout process was too long or complicated.
Source: Baymard Institute, Checkout UX Best Practices 2026
That’s an important finding because it connects an experience problem to a commercial outcome: lost purchases.
However, it doesn’t mean every company can automatically recover 17% of abandoned orders by redesigning checkout. You still need to understand your own customers, identify the causes of abandonment, and measure the effect of any changes.
Good UX research identifies the problem. A strong business case explains why solving that problem matters to the organization.
2. Four business metrics every designer should understand
You don’t need to become a financial analyst to demonstrate the value of your work. But understanding a few fundamental metrics can change how you approach design decisions.
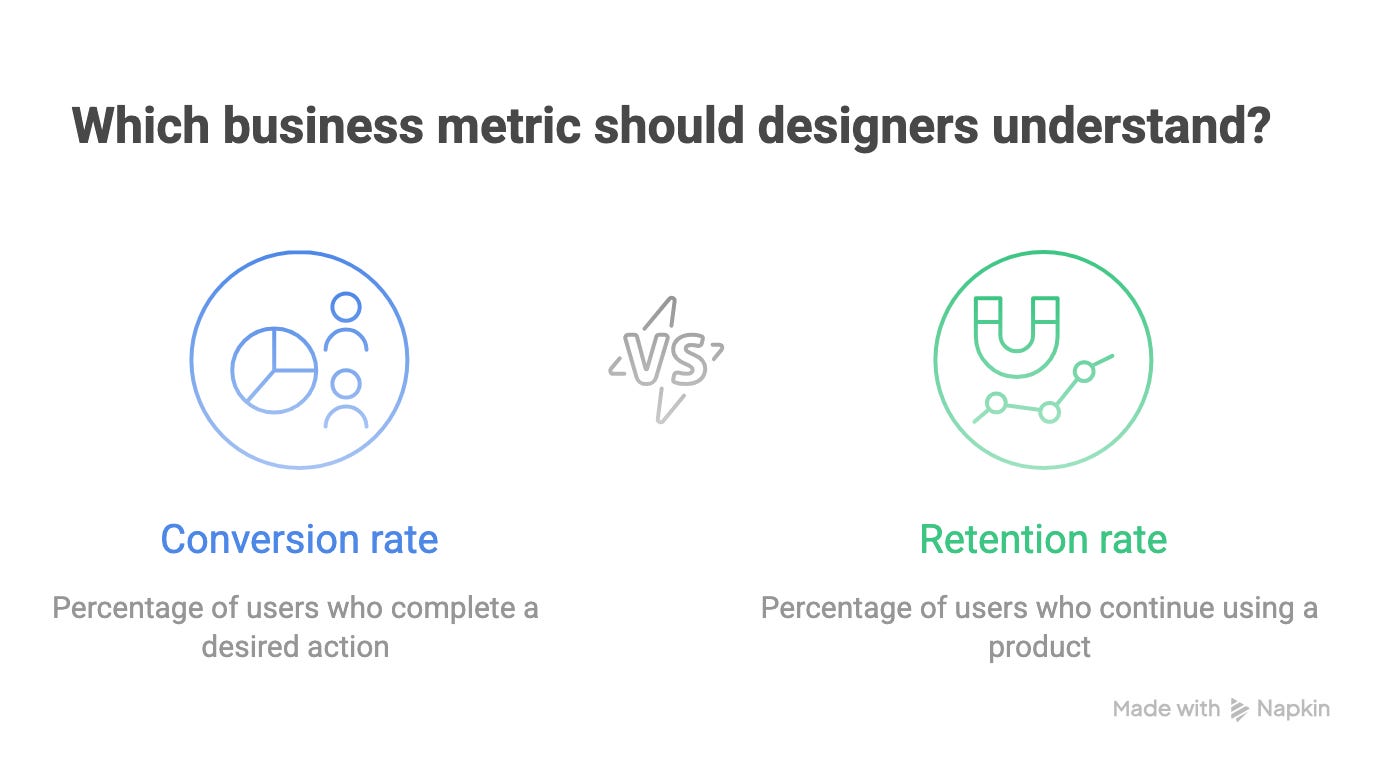
Conversion rate
The percentage of users who complete a desired action, such as making a purchase, registering for an account, or subscribing.
Formula: (Completed actions ÷ Eligible users) × 100
If 2,000 people begin a checkout and 400 complete a purchase, the checkout conversion rate is 20%.
A UX improvement that makes checkout easier could increase this percentage, but the change needs to be measured.
Retention rate
The percentage of users who continue using a product over a defined period.
For example, if 1,000 new users sign up in January and 300 of those same users return in February, the February retention rate for that cohort is 30%, assuming returning is how retention is defined.
Retention is particularly important for subscription products, where keeping existing customers contributes to recurring revenue.
Customer acquisition cost (CAC)
How much a business spends to acquire a new customer.
Formula: Acquisition costs ÷ New customers acquired
If a company spends $10,000 on marketing and sales and acquires 200 customers, its CAC is $50.
Better onboarding or signup experiences can improve the percentage of visitors who become customers, potentially lowering acquisition cost per customer when spending remains stable.
Customer lifetime value (CLV)
An estimate of the financial value a customer contributes over their relationship with a business.
Different companies calculate CLV differently, but the underlying idea is simple: customers who stay longer and continue purchasing can generate more value.
For a subscription product, improvements to onboarding, usability, and retention may contribute to longer customer relationships.
Further reading: Amplitude’s Guide to Product Metrics
These metrics help you move beyond saying, “We improved the user experience,” toward explaining what that improvement could mean for the business.
But understanding the metrics is only the beginning.
The next challenge is knowing how to use them to estimate the financial value of a design decision, without making claims your research can’t support.


