


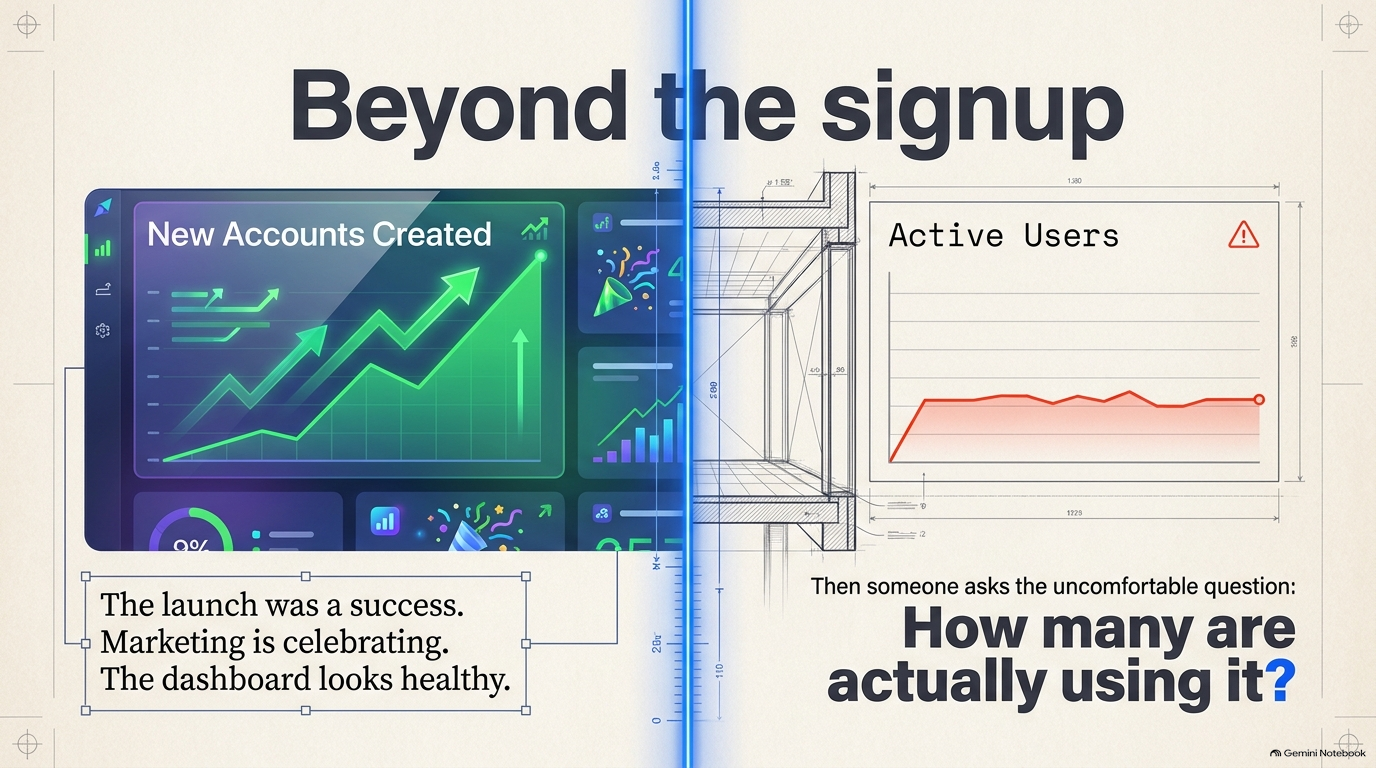
Imagine spending months building a product. You launch it, people sign up, and the numbers start moving.
The team is excited. Marketing is celebrating. The dashboard looks healthy.
Then someone asks a rather uncomfortable question:
How many of those people are actually using the product?
Not how many created an account. Not how many downloaded the app. How many came back because they found something useful?
Suddenly, the growth story looks a little different.
This is the problem with treating signups as proof of product success. Someone can be interested enough to try your product without ever finding a reason to use it again.
And that gap between trying a product and finding value in it is where a lot of product experiences fall apart.
The uncomfortable truth about growth
Acquisition is visible. You can count downloads, registrations, campaign clicks and new accounts.
Retention is harder to celebrate because it asks a more important question: did the product become useful enough for people to return?
Amplitude’s analysis of more than 10,600 products found that 69% of products performing strongly on seven-day activation also performed strongly on three-month retention.
That is a correlation, not proof that improving onboarding alone causes long-term retention. But it points to something product teams should pay attention to: the experience people have early on is closely associated with whether they continue using a product.
Amplitude’s research on product analytics and activation
It also challenges a familiar approach to growth.
When usage is low, the instinct is often to bring in more users. More ads. More campaigns. More downloads. More signups.
But if the experience isn’t giving existing users a reason to stay, bringing in more people may simply mean filling a leaky bucket faster.
The question isn’t always how to get more people in.
Sometimes it’s why the people already there aren’t finding a reason to stay.
A welcome screen is not an onboarding strategy
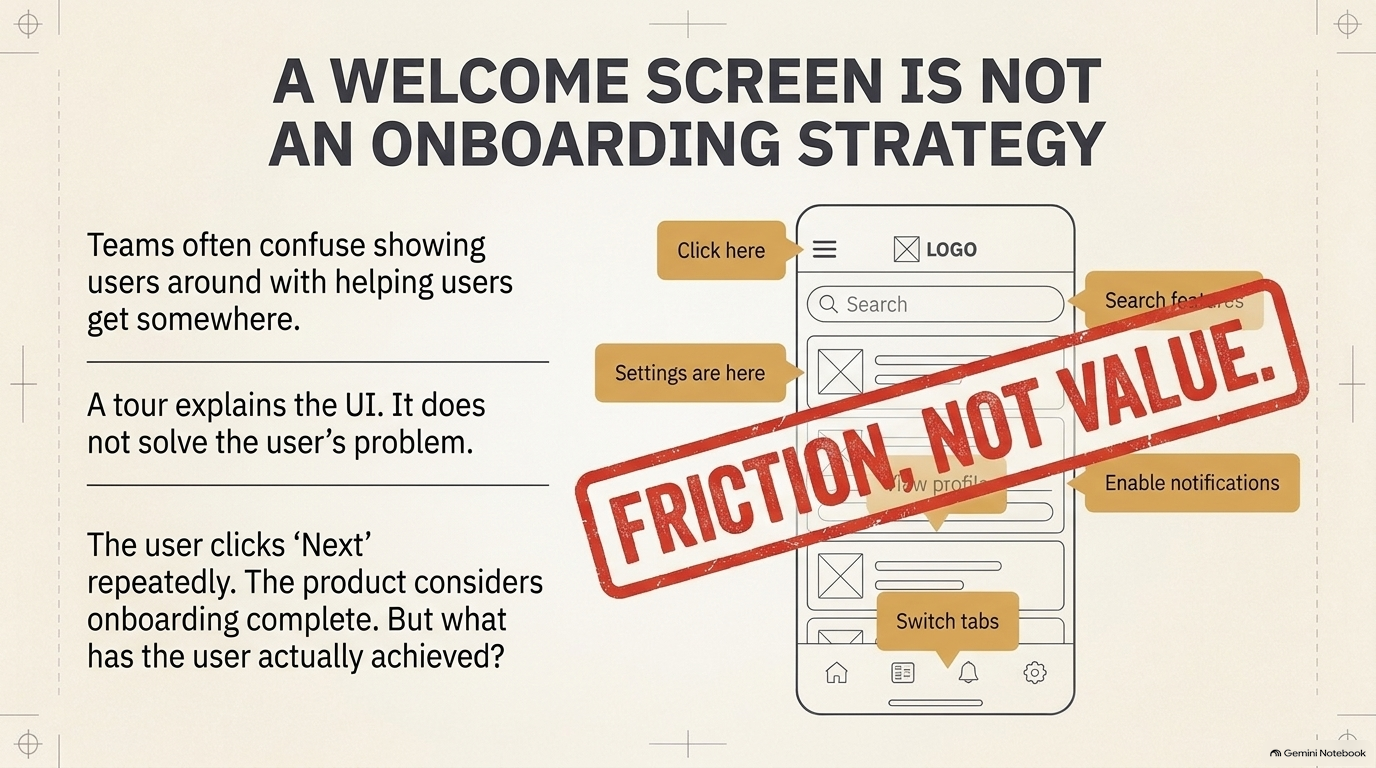
Think about the last time you downloaded an app and were immediately greeted with a series of screens explaining its features.
You clicked Next. Then Next again. You might even have skipped the whole thing.
The product considers onboarding complete.
But what have you actually achieved?
This is where teams sometimes confuse showing users around with helping users get somewhere.
A tour can explain where the settings are, how the navigation works and what each icon does. It can be beautifully designed and still fail to help someone experience the product’s value.
Consider a budgeting app.
A new user probably wants to understand where their money goes. They might want to set a savings target or see how much they spend on food every month.
Instead, imagine the app asking them to complete a profile, select a theme, enable notifications, read six feature descriptions and explore a dashboard before they can see anything useful.
The interface has introduced the product.
It hasn’t helped the user solve their problem.
A better first experience might guide them towards connecting an account, reviewing their spending and identifying one useful insight.
That’s a much stronger introduction because the user has actually received something in return for their effort.
Good onboarding is not a tour of the product. It’s the beginning of the value exchange.
The first few minutes can tell you a lot
There’s a useful distinction between three moments in a user’s journey.
A person signs up. That’s acquisition.
They complete an action that demonstrates they’ve experienced the product’s core value. That’s activation.
They return to continue getting that value. That’s retention.
The tricky part is deciding what activation actually means for your product.
For a project management tool, it might be creating a project and adding a task.
For a music streaming app, it could be playing music and saving a playlist.
For an online learning platform, it might be starting and completing a lesson.
The action should reflect the reason someone came to the product. Completing a profile or clicking through a tutorial might be necessary, but those actions don’t automatically mean the user has found value.
This is also why copying another company’s onboarding flow is rarely a good strategy. The meaningful first action for a banking app is not the same as the meaningful first action for a design tool.
You have to understand what users came to accomplish.
Where did everybody go?
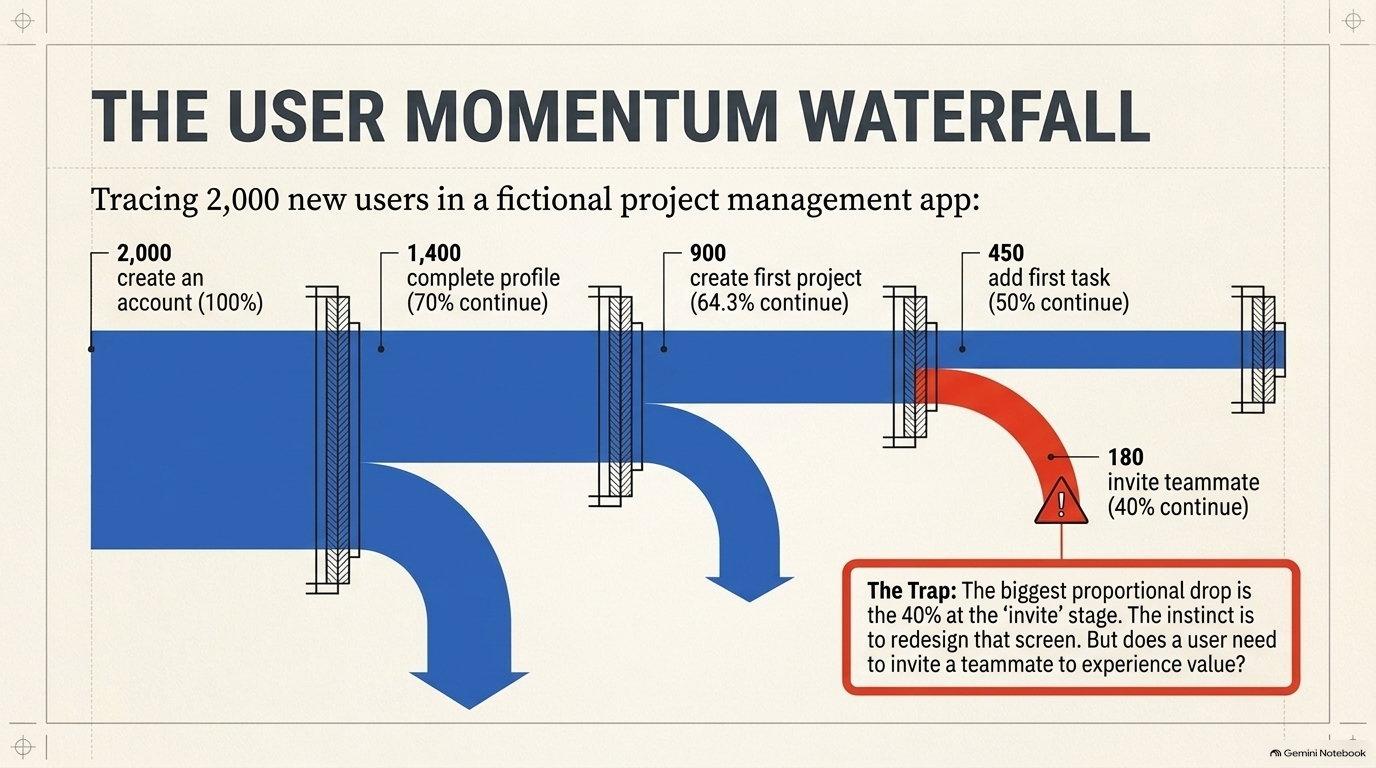
Let’s look at a fictional project management app.
The team has 2,000 new users. The registration numbers are encouraging, but engagement is disappointing.
When the product team looks at the journey, it finds this:
2,000 people create an account.
1,400 complete their profile.
900 create their first project.
450 add their first task.
180 invite a teammate.
The team now has something more useful than a general feeling that onboarding isn’t working.
It has a journey to investigate.
Look at what happens as users move through the experience:
2,000 people create an account.
↓ 70% continue
1,400 people complete their profile.
↓ 64.3% continue
900 people create their first project.
↓ 50% continue
450 people add their first task.
↓ 40% continue
180 people invite a teammate.
That’s quite a journey. And notice how the number of people gets smaller at every stage.
The biggest proportional drop occurs when users are asked to invite a teammate. Only 40% of the people who reach that stage complete the action.
It’s tempting to immediately redesign that screen. But before doing so, the team needs to ask a better question:
Does a user need to invite someone before they can experience the product’s value?
Perhaps someone managing personal projects can get value from creating a project and adding a task. If so, making collaboration a requirement too early could be creating unnecessary friction.
The team should also examine whether users who add a task return more frequently than those who don’t. That could help identify a more meaningful activation event.
This is the difference between fixing the most obvious drop-off and fixing the problem that matters most.
A funnel shows you where people leave. It doesn’t always tell you why.
That’s where research comes in.
The part analytics cannot explain
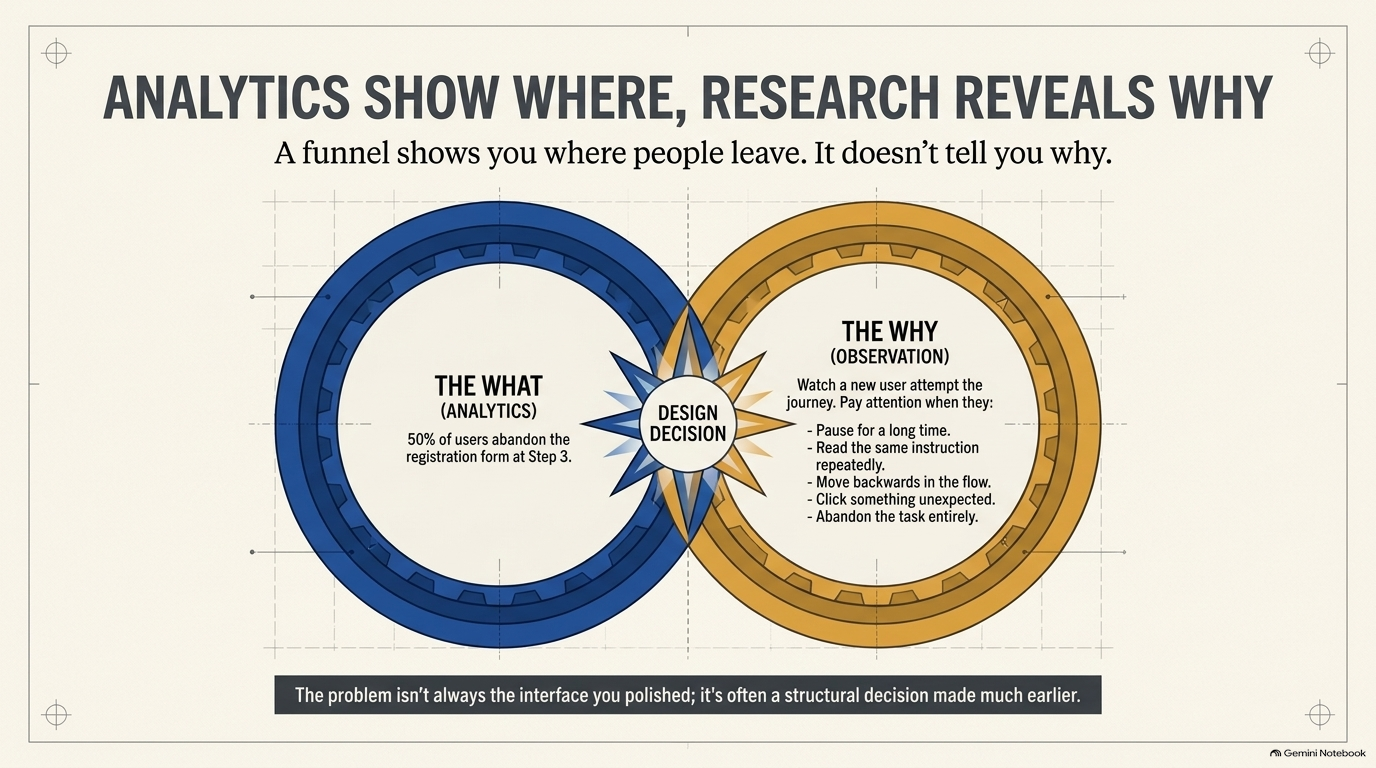
Imagine your analytics show that 50% of users abandon a particular registration step.
You know where the problem is. But you don’t yet know what is causing it.
Maybe the form asks for information people don’t have.
Maybe the instructions are confusing.
Maybe users don’t understand why the information is needed.
Or perhaps the process works perfectly, but the user has simply lost interest because they haven’t seen enough value.
These problems can produce similar numbers but require very different design decisions.
This is why product analytics and user research need to work together.
Analytics helps identify patterns in behaviour. Interviews and usability testing help you understand the experience behind those patterns.
A useful research exercise is to watch a new user attempt the journey without stepping in to help.
Pay attention to the moments when they:
Pause for a long time.
Read the same instruction repeatedly.
Move backwards.
Click something unexpected.
Ask why the product needs certain information.
Abandon the task.
Don’t immediately explain what they should do. Let them show you where the experience is unclear.
And when speaking to people who abandoned the product, ask what they were trying to accomplish, what they expected to happen and what stopped them from continuing.
You might discover that the problem isn’t the interface you spent weeks polishing. It might be one small decision made much earlier in the journey.
How long does it take to experience value?
There’s another metric worth paying attention to: time to value.
This is the time between a user’s first interaction with a product and the point at which they experience a meaningful outcome.
Pendo’s product benchmark research reports an average time to value of 1.5 days across the companies in its benchmark. Its research also reports that the best-performing companies reach that point much faster.
That figure isn’t a target every product should copy. A collaboration tool, a banking app and a tax platform have different definitions of value and different usage patterns.
But it raises a useful design question:
How much effort are we asking people to invest before they get something worthwhile back?
Explore Pendo’s onboarding and product benchmark research
A shorter journey isn’t automatically better. Sometimes a product genuinely needs information before it can deliver a useful experience.
The goal is to make every step earn its place.
If a user can experience value before completing their entire profile, let them. If a feature needs setup, explain why. If the product needs information, ask for it when it becomes relevant rather than collecting everything upfront.
Think of onboarding as a sequence of value exchanges, not a pile of tasks.
A small experiment with a potentially big impact
Let’s return to the project management app.
Suppose the team discovers that many users create an account but never create their first project.
The current flow asks users to complete their profile before they can get started.
The design team proposes allowing users to create a project first and complete the remaining profile information later.
Rather than redesigning the entire product, the team runs an experiment.
It compares two groups:
The original experience, where profile completion comes first.
The revised experience, where users can create a project immediately.
Imagine the results are:
Original experience
1,000 new users enter the flow. 400 create their first project.
Activation rate: 400 ÷ 1,000 × 100 = 40%.
Revised experience
1,000 new users enter the flow. 550 create their first project.
Activation rate: 550 ÷ 1,000 × 100 = 55%.
The difference is 15 percentage points.
The revised experience has also produced a 37.5% relative increase in first-project creation:
(550 − 400) ÷ 400 × 100 = 37.5%.
That is a promising result, but the team shouldn’t declare victory yet.
It needs to check whether the change affects meaningful downstream behaviour. Do more users add tasks? Do they return the following week? Does the experience work for different user groups?
An increase in first-project creation is useful only if it moves people closer to the value the product promises.
The real success metric isn’t whether more people finish onboarding. It’s whether more people become successful users.
A practical exercise: audit the first experience
Take a product you work on, or one you use regularly. Start from the moment a new user creates an account.
Now follow the journey as though you know absolutely nothing about the product.
Write down the first meaningful outcome the user should reach. Then map every action required to get there.
For each action, ask:
Does this help the user reach their goal?
Is it essential before they experience value?
Is the reason for asking clear?
Could it happen later?
What happens if the user skips it?
Finally, identify the point where users are most likely to abandon the journey. Check the analytics if you have access to them. If you don’t, observe a few people attempting the experience and record where they struggle.
Your output should be a specific design hypothesis, not a vague intention to improve onboarding.
For example:
“We believe that allowing users to preview their first report before completing their full profile will increase report creation because users will see the product’s value earlier.”
That’s something a team can discuss, design, test and measure.
What to measure after the redesign
Don’t rely on one metric to tell the whole story.
A useful starting point is to track:
Activation rate: What percentage of new users complete the action that represents meaningful first value?
Time to value: How long does it take them to get there?
Step-by-step conversion: Where are users progressing, and where are they dropping off?
Day-seven retention: What percentage of the original group returns on day seven?
Core feature adoption: Are users actually using the features that solve the problem they signed up to address?
Be careful with comparisons. Define your user cohort, activation event and measurement window consistently. A day-seven return rate, for example, is different from a measure that counts anyone who returned at any point during their first seven days.
And remember that retention depends on the type of product. A daily-use app should not be judged by exactly the same return pattern as software used once a month.
The point is to measure behaviour that reflects the product’s purpose, not to chase a benchmark simply because another company achieved it.
The real question isn’t why they signed up
It’s why they would come back.
A user doesn’t owe your product another visit simply because they created an account.
They return because the product helped them do something, made a difficult task easier, saved them time, or gave them an experience worth repeating.
That’s the promise the design needs to deliver.
So the next time a team celebrates a rise in registrations, ask what happened after the signup.
Did users reach the thing they came for?
Did they understand how to get value?
And did they have a reason to return?
Because a product’s first impression isn’t just what people see when they open it.
It’s what they manage to accomplish.
Resource Corner
Amplitude: What Is Product Analytics?
https://amplitude.com/explore/analytics/product-analytics-guideAmplitude: The 7% Retention Rule Explained
https://www.amplitude.com/blog/7-percent-retention-rulePendo: How to Build User Onboarding That Boosts Retention
https://www.pendo.io/resources/how-to-build-user-onboarding-that-boosts-retention/Pendo: Product Benchmarks.
https://www.pendo.io/product-benchmarks/
Final Note
At UXU, we’re interested in helping UXers move beyond making interfaces look and feel better. We want to build the ability to understand user behaviour, ask sharper product questions and make design decisions that improve real outcomes.
Because the work doesn’t end when someone clicks Sign Up. That’s where the experience really begins.


