



Here is a number that should humble everyone in this field: only about 17% of A/B tests produce a winner.
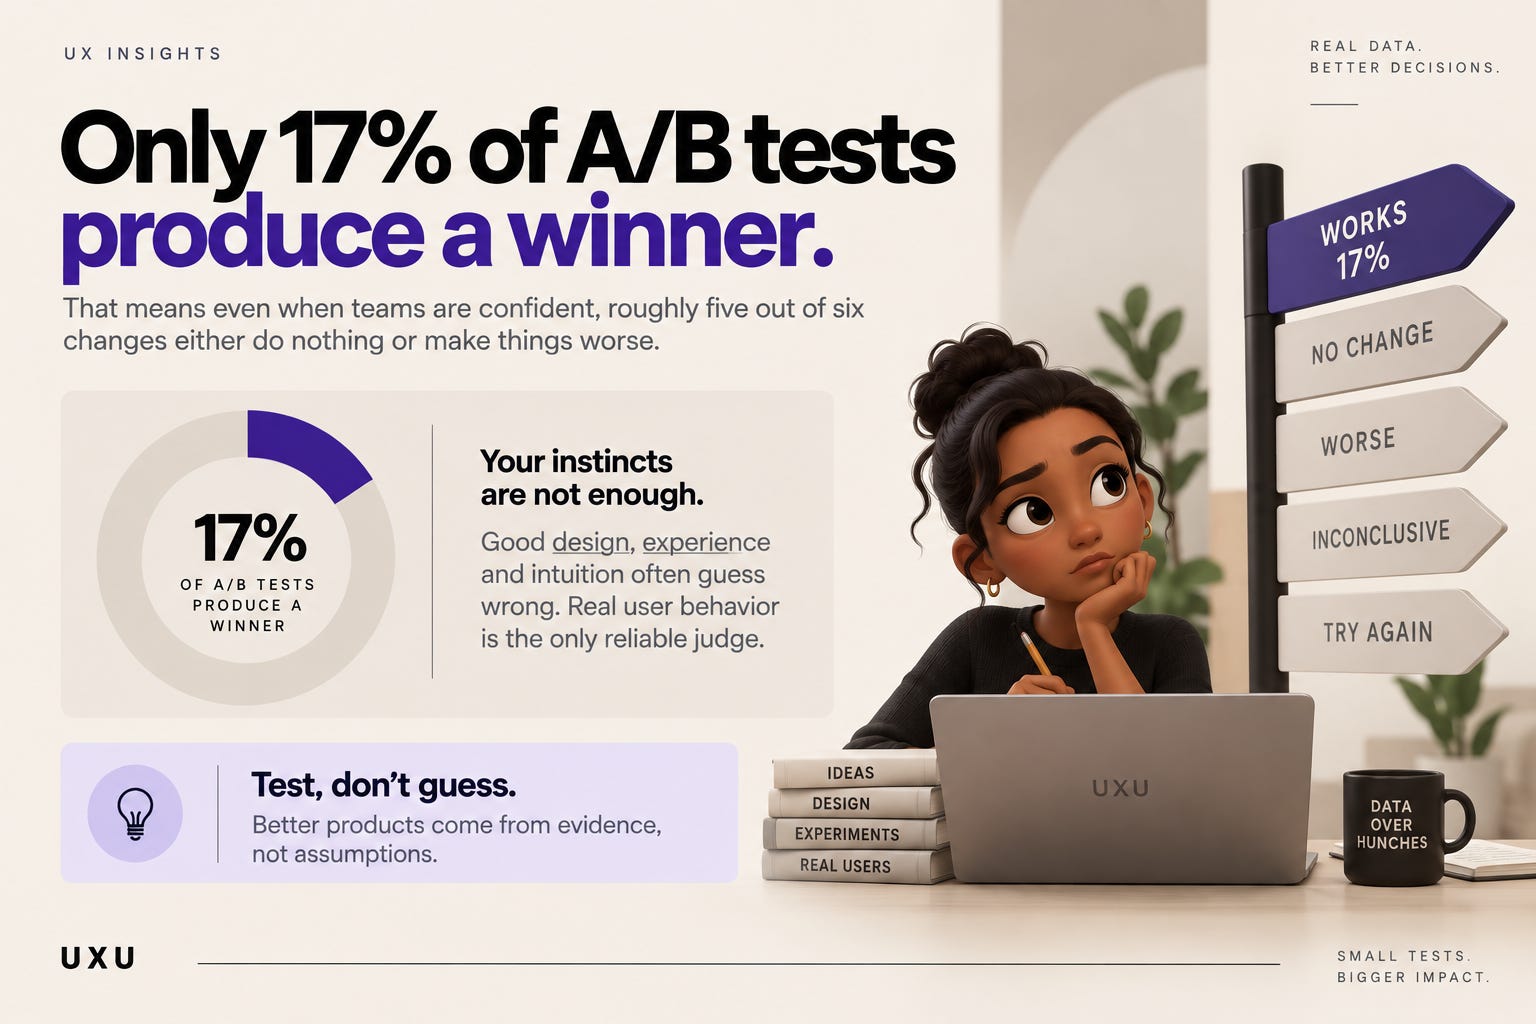
Read that as what it is. When designers and product teams change something they are sure will help, roughly five out of six times it either does nothing or makes things worse. Your instincts, your taste, your years of experience, all of it, guesses wrong most of the time. Even experienced designers routinely mispredict what users will actually do.
That sounds bleak. It is actually the most useful thing you can know, because it points straight at what separates teams that improve from teams that just ship. This issue is about what the experimentation data really says, and how to end up on the winning side of that ratio.
In this issue:
The humbling truth about your instincts
Why research-backed tests win 3x more often
What actually wins, by test type
The compounding math nobody talks about
How to test like the teams that win
Resource Corner
The humbling truth about your instincts
The consensus across large datasets is remarkably consistent, and remarkably sobering.
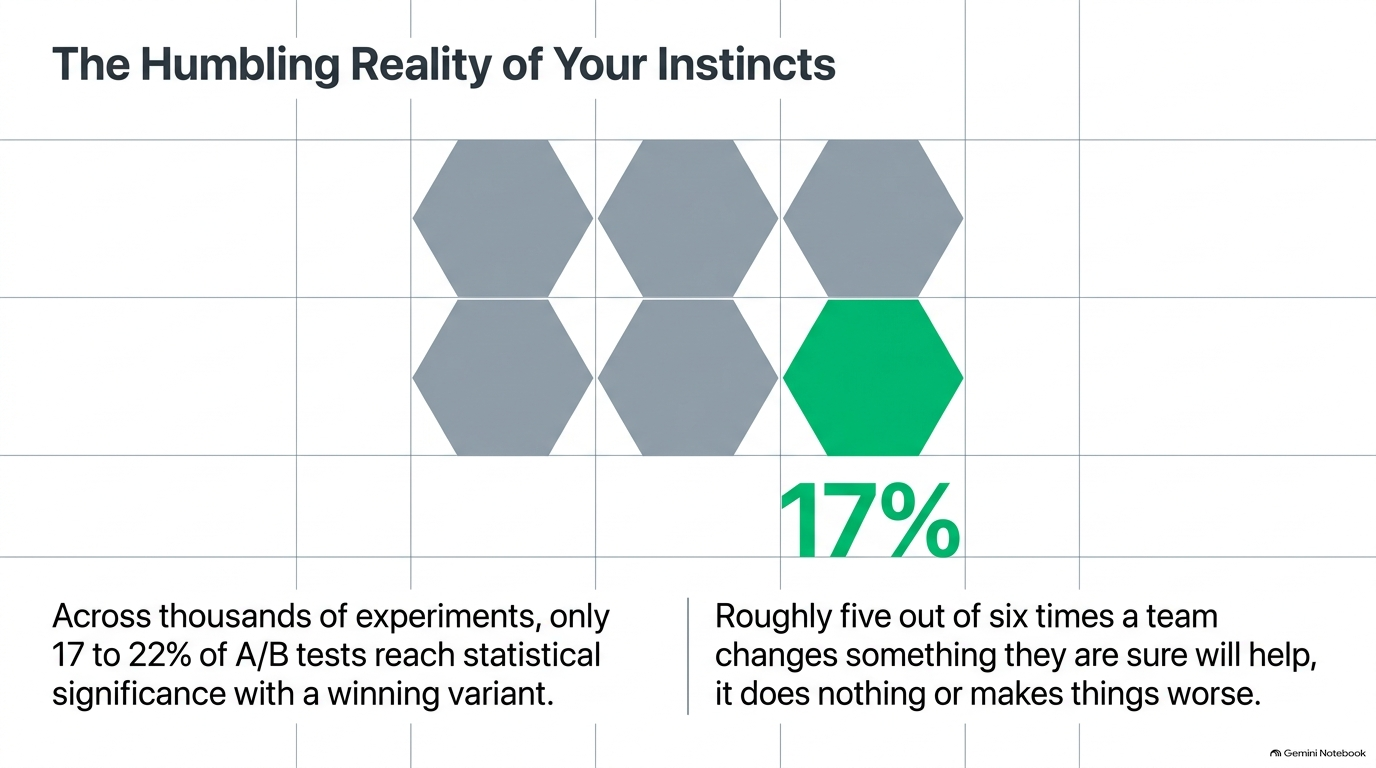
Across thousands of experiments, only 17 to 22% of A/B tests reach statistical significance with a winning variant. The rest lose or show no detectable difference. The old CRO rule of thumb, “1 in 8 tests wins,” turns out to be slightly too pessimistic for well-run programs today, but not by much. The real figure sits around 1 in 6.
The lesson is not that testing is futile. It is that intuition is unreliable, and the field has been quietly overconfident about it for years. The whole value of A/B testing is that it replaces opinions with evidence. Without it, every design decision, every copy change, every “this will obviously convert better” is a guess, and the data says most of those guesses are wrong.
This is why the teams that win are not the ones with the best taste. They are the ones humble enough to test their taste against reality, and disciplined enough to keep only what actually works.
Why research-backed tests win 3x more often
Here is the number that changes everything, and it is the reason UX research earns its seat at the table.
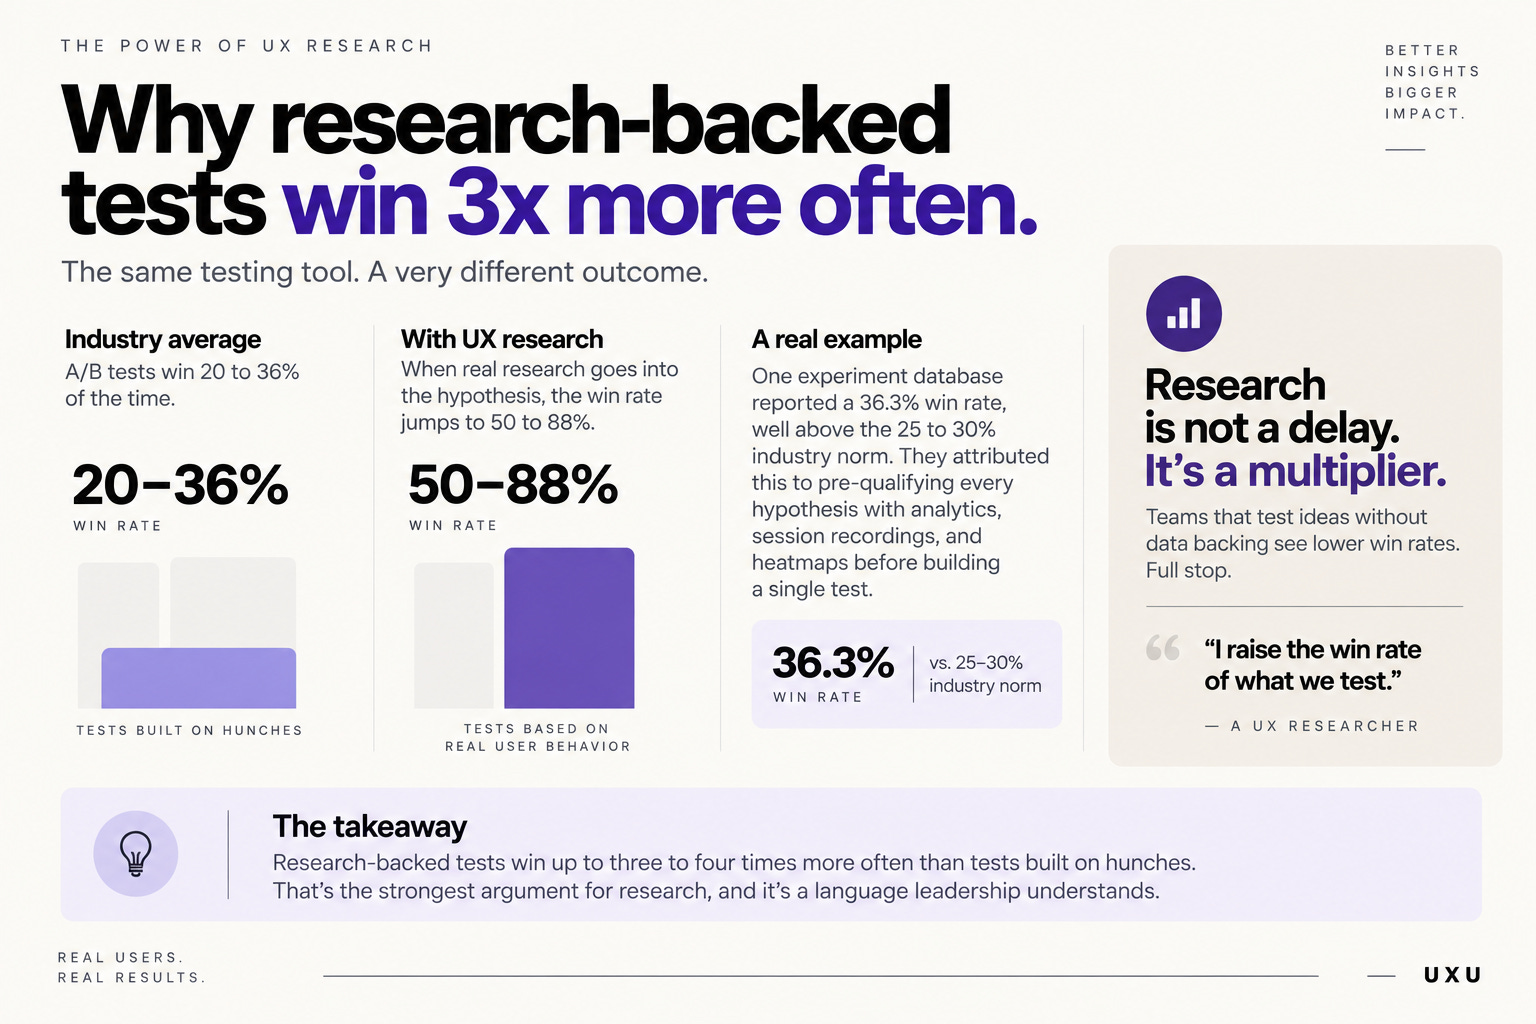
The average A/B test wins 20 to 36% of the time. But when real UX research went into building the hypothesis, when the test was based on actual user behavior instead of a brainstorm, the win rate jumps to 50 to 88%.
Sit with that gap. Research-backed tests win up to three to four times more often than tests built on hunches. The difference is not the testing tool. It is where the idea came from.
One experiment database made this explicit. Their overall win rate was 36.3%, well above the 25 to 30% industry norm, and they attributed the difference directly to pre-qualifying every hypothesis with analytics, session recordings, and heatmaps before building a single test. Their words: teams that test ideas without data backing see lower win rates. Full stop.
This is the strongest argument for research that exists, stated in the language executives care about. Research is not slow overhead that delays shipping. It is the thing that triples your odds of the change actually working. A researcher who frames their value this way, “I raise the win rate of what we test”, is speaking directly to the metric leadership already tracks.
What actually wins, by test type
Not all tests are equal. The data shows huge variation in win rate by what you change, and it is genuinely useful for deciding where to spend effort.
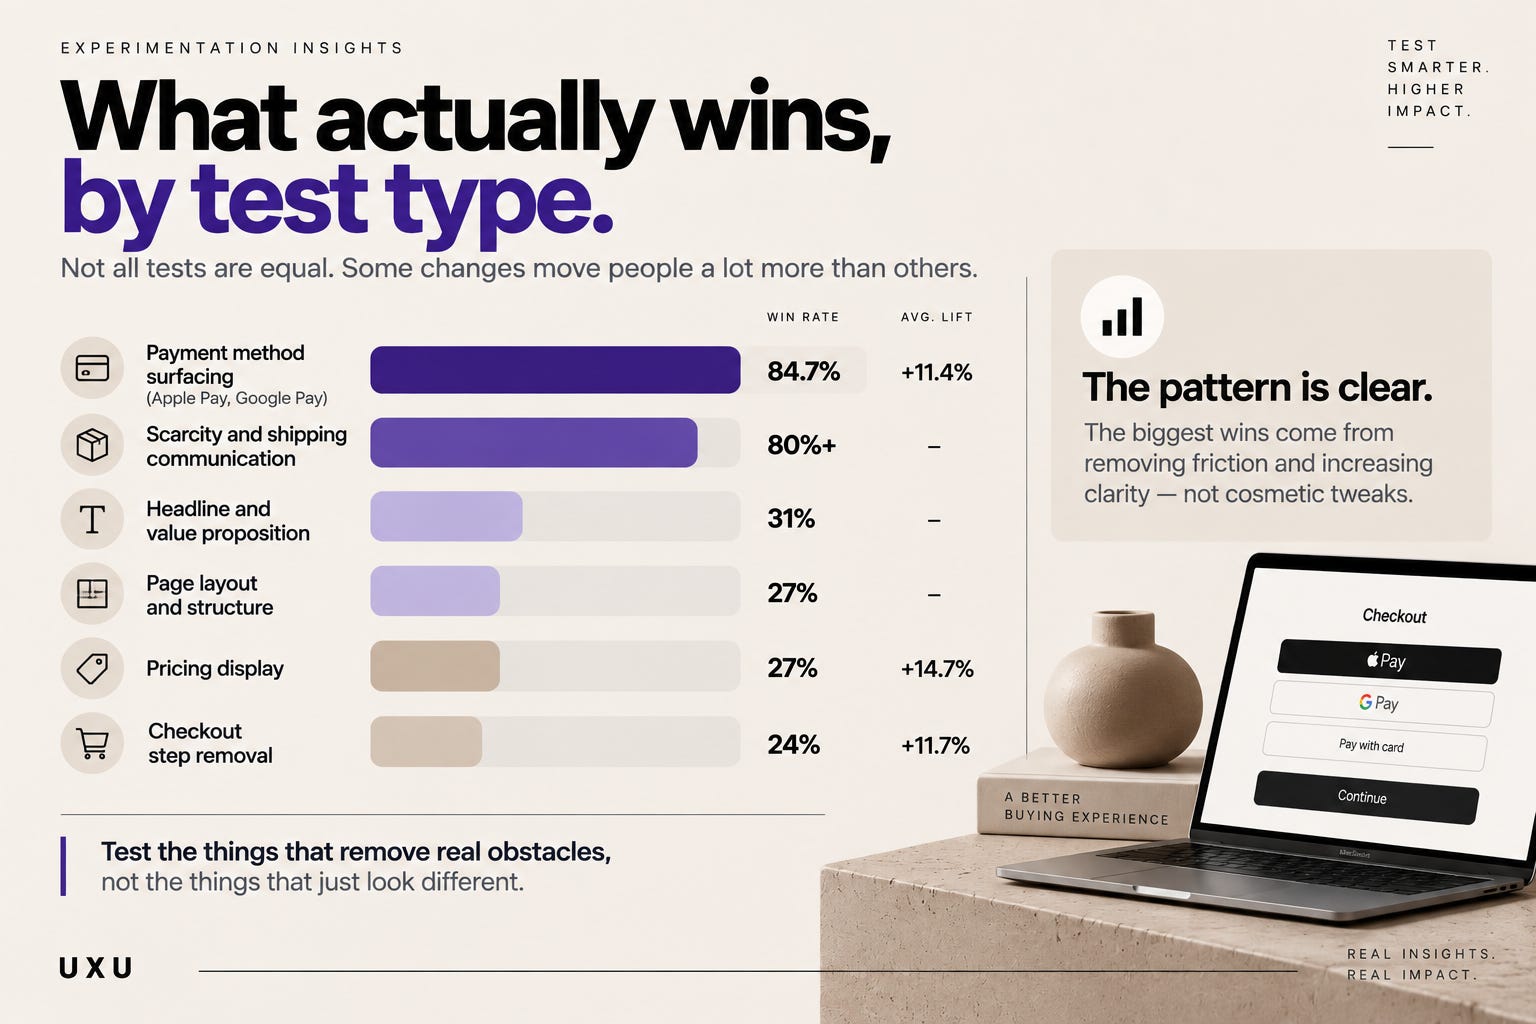
The highest performers:
▸ Payment method surfacing (adding Apple Pay, Google Pay): 84.7% win rate, +11.4% average lift. The single most reliable test type in the data.
▸ Scarcity and shipping communication: win rates above 80% in some datasets. How you communicate delivery and availability moves people hard.
▸ Headline and value proposition: 31% win rate, the highest of the “messaging” category. Changing what you say beats changing how you say it.
▸ Page layout and structure: 27% win rate. Reordering sections and fixing hierarchy produces real results.
▸ Pricing display: 27% win rate, but a high 14.7% average lift when it works.
▸ Checkout step removal: 24% win rate, +11.7% lift. Fewer steps, more sales.
The pattern worth noticing: the biggest wins cluster around friction and clarity, payment ease, checkout simplicity, clear messaging. Cosmetic tweaks like button colors win far less often than people expect. Test the things that remove real obstacles, not the things that just look different.
The compounding math nobody talks about
A single test rarely changes a business. This is where most teams give up too early. The real power is in the cadence, and the math is genuinely striking.
Run 24 tests a year. Say 22% win, at a median 18% lift. That is roughly 5 wins. Five improvements of 18%, compounded across the year, yield a 129% cumulative improvement on the tested funnel.
Another model: one test a month, 20% win rate, 10% average lift, compounds to a 27% improvement in a year, and 61% over two.
The insight is that experimentation is not about the home run. It is about consistent, disciplined singles that stack. And there is a threshold effect: programs running fewer than 24 tests per year tend to deliver a net-negative return, because they do not run enough tests to overcome the losers and inconclusive results. Testing occasionally is worse than not testing at all, because it costs effort without reaching the volume where compounding kicks in.
Here is the wild part. Despite all this, only about 0.2% of websites run structured tests at all. The teams that treat experimentation as a habit are quietly taking market share from everyone still shipping on opinion.
How to test like the teams that win
The gap between a winning program and a wasteful one comes down to discipline. Concretely:
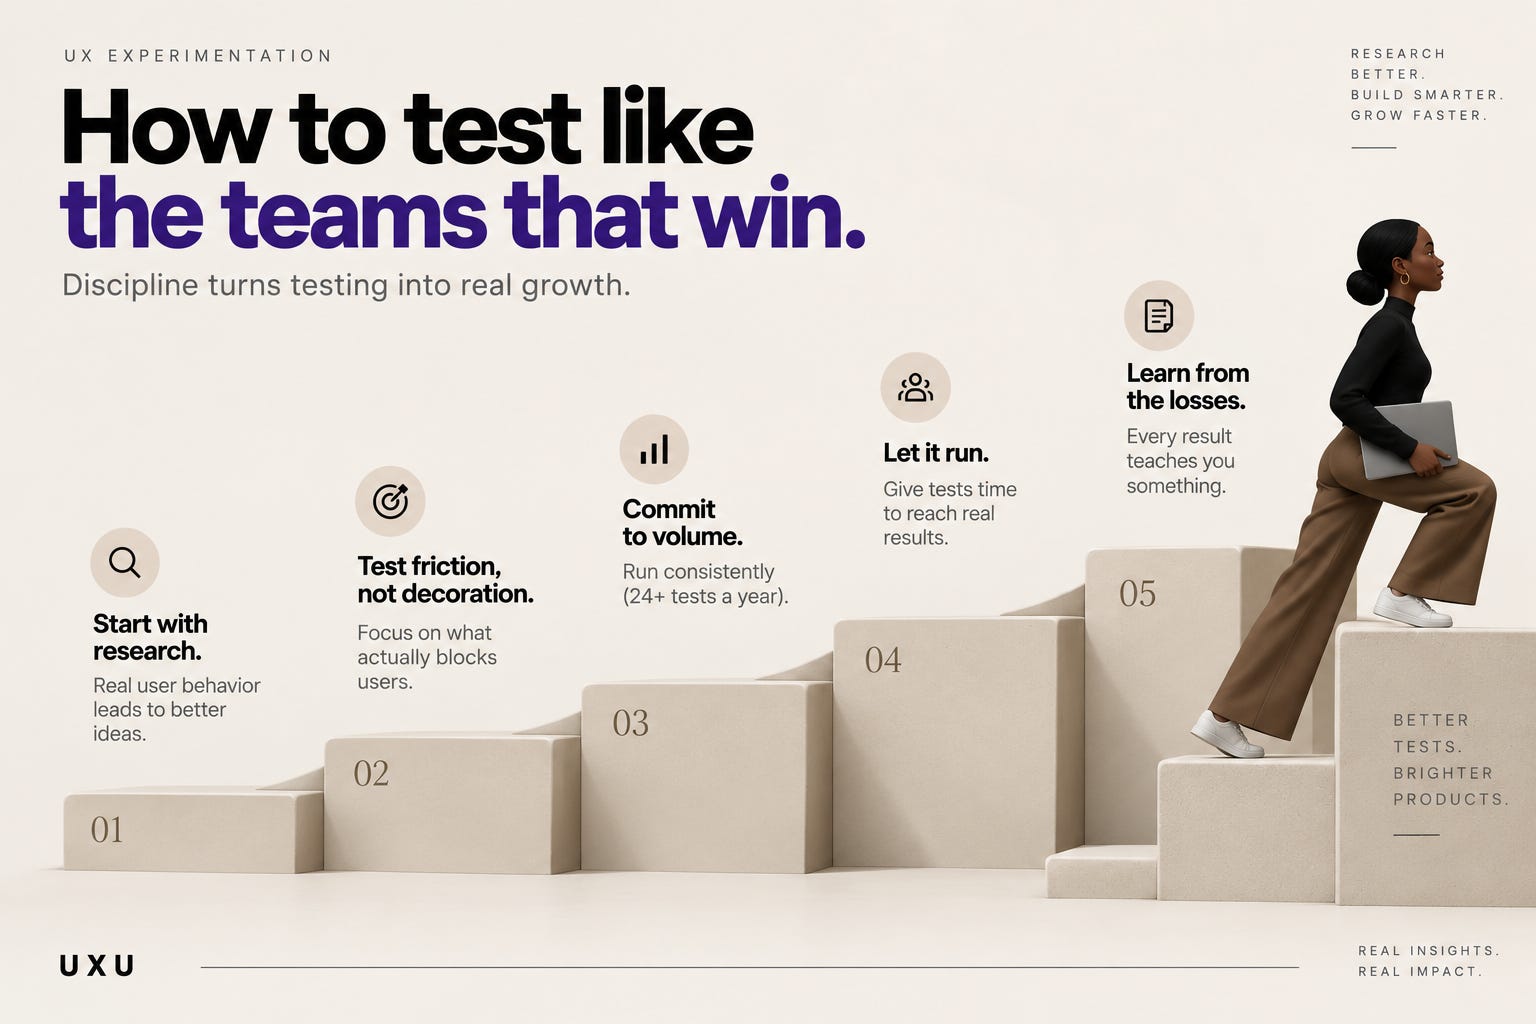
✅ Start every test with research, not a brainstorm. This is the single highest-leverage rule. Pull the analytics, watch the session recordings, read the support tickets, find where users actually struggle. Hypotheses grounded in real behavior win up to 88% of the time. Hypotheses from a whiteboard win 20%.
✅ Test friction, not decoration. The data is clear that payment ease, checkout simplification, and messaging clarity win far more than cosmetic changes. Point your tests at real obstacles in the funnel, not at button colors.
✅ Commit to volume or don’t bother. Fewer than 24 tests a year tends to lose money. If you are going to run an experimentation program, resource it to run consistently, or the compounding never kicks in.
✅ Let tests reach real sample size. A huge share of “inconclusive” results come from tests stopped too early. Calling a winner before you have the numbers is how false positives sneak in, the ones that get rolled back later. Patience is part of the method.
✅ Track the losers honestly. If someone claims they win almost every test, ask how they define a win and whether they are quietly ignoring failures. Winning teams learn as much from the 5-in-6 that don’t win as from the ones that do.
Quick pause. This belongs in the room.
🎯 FALL TECH HAPPY HOUR
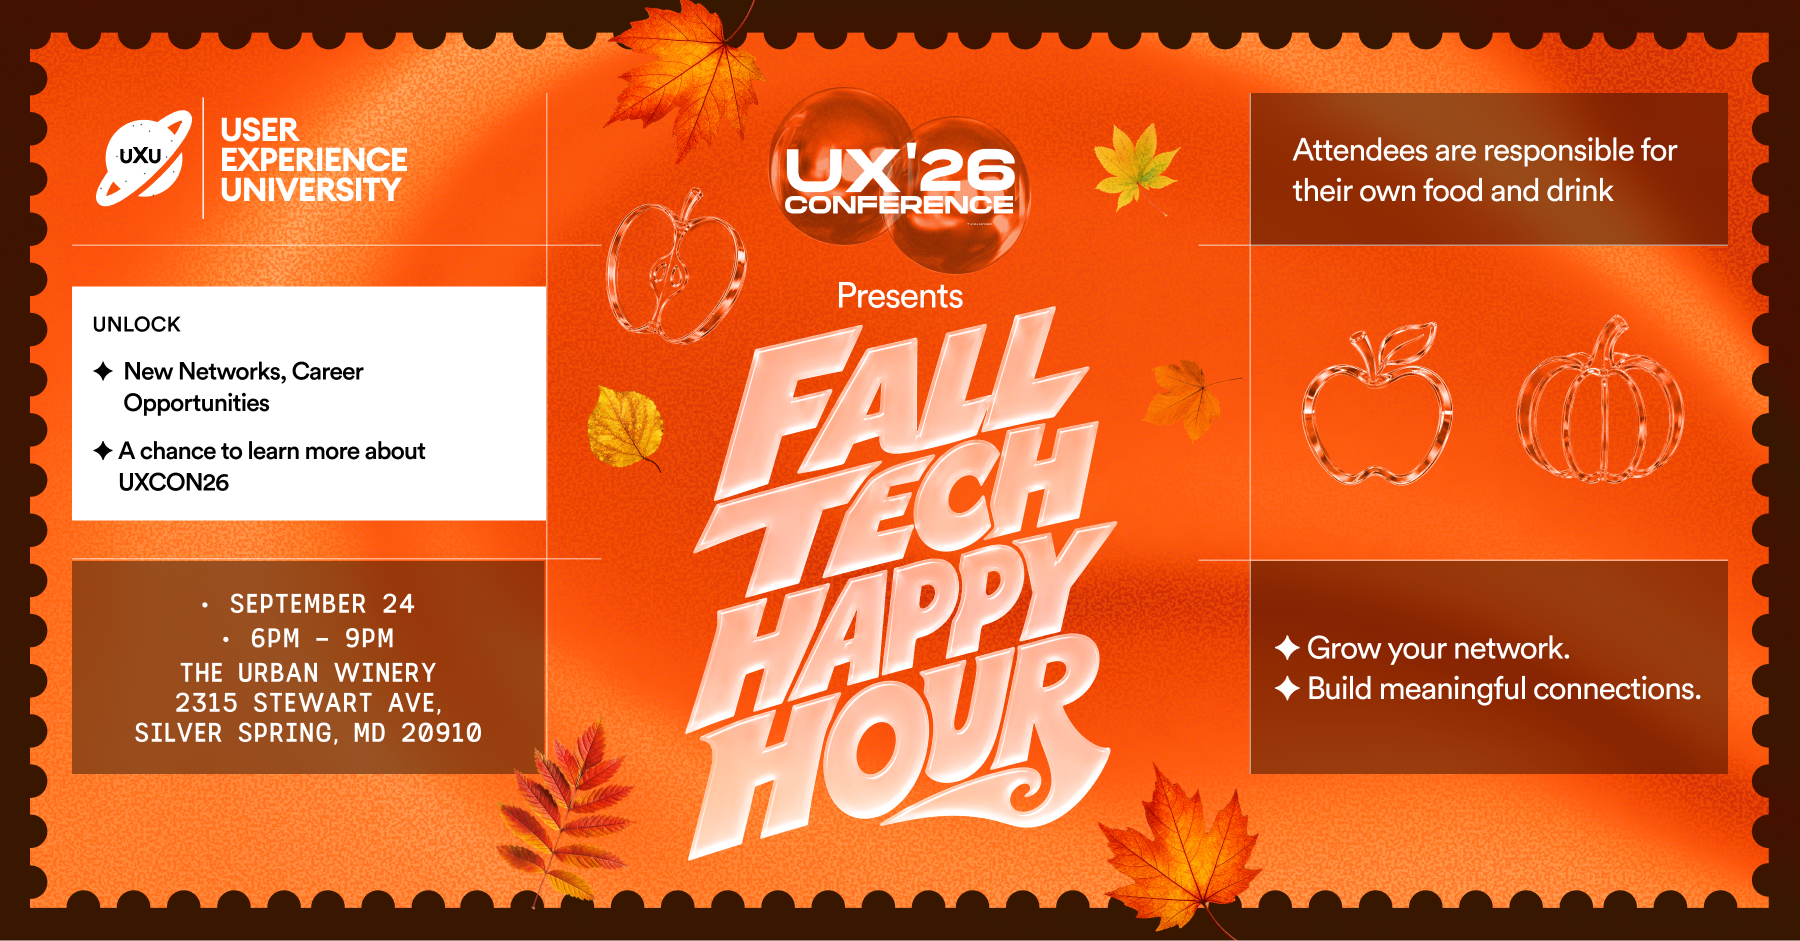
The job market shifted. The way people hire shifted with it. Warm intros beat cold applications. A five-minute conversation beats a hundred cover letters. And the people who get ahead aren’t the ones refreshing job boards, they’re the ones already in the room.
This is that room.
DMV’s UX, product, design, and tech community, in one place, for one evening. No stage, no pitch, no agenda. Just the people who can actually move things forward for you, face to face.
Fall Tech Happy Hour. September 24. The Urban Winery, Silver Spring.
📦 Resource Corner
A/B Testing Statistics 2026: What 4,200 Experiments Tell Us (Visionary)
The most thorough current dataset, with win rates broken down by test type and honest talk about inconclusive results. The source behind most of the numbers here. Essential reading.
Quantifying the Impact of UX Research with A/B Tests (UserTesting)
Thirteen experts on the finding that matters most: research-backed tests win 50 to 88% of the time versus 20 to 36% without. The best resource for making the business case for research.
A/B Testing Statistics: E-Commerce Experiments (DRIP)
Real data from 90+ brands on why pre-qualifying hypotheses with research raises win rates. Clear, practical, and specific about what actually moves the needle.
A/B Testing: Complete Guide 2026 (Digimau)
A solid end-to-end guide on designing, running, and analyzing tests properly, including the compounding math. Good for anyone setting up a program from scratch.
Trustworthy Online Controlled Experiments by Kohavi, Tang, and Xu
The definitive book on experimentation, from people who ran it at Microsoft, Amazon, and Google. Dense but authoritative if you want to go deep on doing testing right.
💭 Final Thought
The uncomfortable takeaway is that you are probably wrong more often than you think. Five out of six confident improvements do not pan out. That is not a knock on your skill. It is just how complex human behavior is, and no amount of experience fully fixes it.
But that humbling fact is also the opportunity. If everyone’s instincts are unreliable, then the edge does not go to the person with the best taste. It goes to the person who grounds their ideas in real user research, tests them honestly, and keeps only what actually works. That is a game anyone can win with discipline, and almost nobody is playing, only 0.2% of sites test at all.
Research is what tips the odds. It turns a 20% win rate into an 80% one. It is the difference between guessing and knowing.
Stop shipping on opinion. Find where users actually struggle. Test it. Keep what works.
Your instincts are a starting point, not an answer.
--- The UXU Team


